ArgoCD and Health Checks, or how to avoid Kubernetes "eventual consistency"
Or how health checks avoid me from running into issues with controller-managed resources
Here’s an interesting problem I ran into while doing some work a few days ago. I was working on a pipeline to deploy new resources using ArgoCD. Everything was going great until one of the Kubernetes resources was, in fact, a resource managed by a Kubernetes controller: that is, applying it will not create it, it will merely tell the controller to create it, eventually.
In practical terms, during my time at Sourced Group, we’ve been working closely with Anthos and some of their applications, including Anthos Config Connector, a nifty little controller that allows you to declare Google Cloud resources as Kubernetes YAMLs, and have this Config Connector – or ACC for short – create them for you.
Everything was going great, however, we run into a roadblock: on automation, if we want to create, say, a Redis Database, and right after we want to start using it, we want to know whether the database was actually created and it’s ready to serve requests. Sounds easier said than done.
Kubernetes “eventual consistency”
The way that Kubernetes operates is by following a model called “eventual consistency”. In Layman’s terms, it’s a way of saying that if there are no new updates to a system, eventually, the system will converge into the desired state. Want a better explanation? Here!

For the Kubernetes operator side of things, this means that we will deploy the Kubernetes YAML onto the cluster, and then the ACC controller will start running in the background and attempt to create the database. This can either fail or succeed, of course, but it will eventually converge into the desired state, which is: I want to have a database.
The problem is, this “convergence” happens asynchronously: after applying your YAML, Kubernetes will not wait until the resource is ready to report back, and neither your automation tools like GitOps would do. What will happen is, Kubernetes – or your automation tool – will apply the manifest and move on to the next manifest, without waiting to know if the first one actually succeeded and was created or not.

In Helm, there are some ways people have found out to semi-solve this problem. It’s quite common, for example, to use Helm hooks to wait for a resource to be ready. That of course, depends if you can actually pack this “hook” validation to do what’s supposed to do. On SQL databases, this could be checking whether the DB can receive connections by attempting to establish a TCP connection to it and see if it responds, with a tool like wait-for, which leds to the question: how can you do something like this for any Kubernetes resource that is done through a controller and manage through a GitOps tool like ArgoCD?
Enter ArgoCD Health Checks

The easiest way to work this out, if you’re using ArgoCD like I am, is to use ArgoCD’s own Health Checks. In practice, ArgoCD ships with a plethora of health checks that you can use to validate certain resources. By default, it will automatically apply these health checks to:
- Deployments, ReplicaSets, StatefulSets and DaemonSets
- It will look for the observed generation being equal to the desired generation, as well as the updated number of replicas to be equal to the number of desired replicas.
- Services
- It will check if the service is a
LoadBalancer, and ensure thestatus.loadBalancer.ingresslist isn’t empty, and validate that there’s at least one value forhostnameorIP.
- It will check if the service is a
- Ingress
- Similar to the Service object, it will check if
status.loadBalancer.ingressis not empty, and validate that there’s at least one value forhostnameorIP.
- Similar to the Service object, it will check if
- PersistentVolumeClaims
- It will check that the PvC is actually
Bound, by looking at thestatus.phasefield.
- It will check that the PvC is actually
For other resources, well, you’re out of luck. Well, kind of. ArgoCD has opened up these health checks to the community so people can contribute their own: they’re all available in the resource_customizations folder of their Github repository where the first folder is the API Group, and the next folder is the resource kind.
If you cannot find a health check for your resource, you can also create one yourself – and potentially contribute it upstream by pushing it to this folder in the repository. The process is quite simple: you need to write your own Health Check using Lua as the language, then use the argocd-cm ConfigMap that ships with the standard ArgoCD installation.
Writing one is quite simple too. For example, in my case scenario I wanted to make sure a SQL database could be successfully created (or updated), so I really have 3 states:
- In progress of being created or updated: which is mapped to ArgoCD’s
Progressingstate. - Failed to be created or updated: which is mapped to ArgoCD’s
Degradedstate. - And finally, the database is ready to be used: which is mapped to ArgoCD’s
Healthystate.
Out of the box, the state is already Progressing when it’s submitted to ArgoCD, so we can skip that one out by taking it as a given. We really need to control the remaining two states. This is done by looking at the Kubernetes Component Status. In fact, Google suggests you to do just that: use kubectl and the subcommand wait to wait for the resource to be ready.
If we were to do that, however, we’ll run into the issue that now our app needs to ship with a $KUBECONFIG or other sort of authentication when it’s being deployed – or use a third-party actor like a CI/CD pipeline to validate it for us. Too complicated – although without knowing ArgoCD enough, it was my first idea.
Writing a Health Check for ArgoCD
So let’s write a custom health check that will work for a Cloud SQL resource. We have two statuses which are derived from the SQL instance, the healthy status – highlighted below:
sql-instance.yamlapiVersion: sql.cnrm.cloud.google.com/v1beta1
kind: SQLInstance
metadata:
name: sqlinstance-sample-mysql
spec:
databaseVersion: MYSQL_5_7
region: us-central1
settings:
tier: db-f1-micro
status:
conditions:
- lastTransitionTime: "2022-01-20T23:29:45Z"
message: The resource is up to date
reason: UpToDate
status: "True"
type: ReadyAnd, if something happens here, the unhealthy or “something happened” status – also highlighted:
sql-instance.yamlapiVersion: sql.cnrm.cloud.google.com/v1beta1
kind: SQLInstance
metadata:
name: sqlinstance-sample-mysql
spec:
databaseVersion: MYSQL_5_7
region: us-central1
settings:
tier: db-f1-micro
status:
conditions:
- lastTransitionTime: '2022-01-24T19:19:02Z'
message: >-
Update call failed: error applying desired state:
long explanation here of the error
reason: UpdateFailed
status: 'False'
type: ReadyYou can see here we get a few fields, like:
status.conditions[].type: the type of the condition, which isReadyin this case; other cases might not have this field, but in this case it seems to be used to let us know the operation of “doing something with this resource” already happened.status.conditions[].status: the status of the condition, which can beTrueorFalsehere. This seems to be used as a boolean to determine if the resource is healthy or not.status.conditions[].reason: the reason for the condition, which can have a plethora of conditions here, all documented in the Anthos Config Connector-specific events. We really don’t care about the intermediate states, we want to know if the resource handling succeeded or not.
You will notice, by the way, that each controller might define their own way of “reading” these conditions so take the understandings above with a grain of salt, plus Google’s own documentation. To know more about these statuses and conditions and the rest, Maël has an excellent article about it.
An initial version of the health check would look like this:
sql-health-check.luahealth_status = {}
if obj.status == nil or obj.status.conditions == nil then
return hs
end
for i, condition in ipairs(obj.status.conditions) do
if condition.type == "Ready" then
health_status.message = condition.message
if condition.status == "True" then
health_status.status = "Healthy"
health_status.message = "The SQL instance is up-to-date."
return health_status
end
if condition.reason == "UpdateFailed" then
health_status.status = "Degraded"
return health_status
end
end
end
health_status.status = "Progressing"
health_status.message = "Provisioning SQL instance..."
return health_statusYou can see here a couple of things: in the top-level code block we declared a health_status object. At the end of the health check we always set the fields .status and .message, these are the statuses shown in the ArgoCD UI and CLI. Concretely, we’re setting the status to Progressing – one of the ArgoCD states – and the message, which is displayed in the sidebar that pans out when you click on a resource, to the Provisioning SQL instance... value, so users understand what’s going on with their resource.
Then in the middle, as we saw above, we first make some Lua code to be able to iterate over the potential array of objects in the status.conditions field of Kubernetes, and we look for a condition.type of value Ready, which is the last condition of the list of possible conditions. Then we “copy” the initial message under the if statement, so we can bubble up the error message appropriately if something goes wrong.
Inside the loop now, we look at condition.status to be True which happens, based on the data above, when the resource successfully gets created or updated. We short-circuit the loop by returning here with a status of Healthy and a custom message to be displayed by ArgoCD in the metadata of the resource. Otherwise, we continue and look to know if the value is UpdateFailed – documented here – which lets us know the apply process failed. Now, we bubbled up the original error message above for this and other situations except “success”, so the original controller message will be propagated to the user too, which is great.
Keep in mind that without the health check, ArgoCD would’ve applied-then-finished the pipeline, but with the health check in place, now we can wait until the resource is healthy, like you would do with one of the StatefulSets or other resources from ArgoCD that include these checks.
Unit-testing these changes
Of course, your next step might be to unit-test these changes. Here you will probably need a bit of knowledge in Go, which is out of the scope of this explanation.
You can unit test your health checks by writing a health check, alongside a test case list, and the example YAMLs you want to check. Start by cloning the ArgoCD repository to your local machine. If you have Go installed, the unit testing process should be fast. Otherwise, you might have to resort to use Docker to run the tests.
Once you have it cloned, navigate to the folder resource_customizations/, and, since we’re testing SQL instances, you need to create a folder structure named $API_GROUP/$KIND inside the folder mentioned before. In my case, I’ll test the SQL database by proposing two case scenarios: the failure and the success we wrote above.
The tree looks like this:
tree sql.cnrm.cloud.google.com/SQLInstance/
sql.cnrm.cloud.google.com/SQLInstance/
├── health.lua
├── health_test.yaml
└── testdata
├── failed.yaml
└── healthy.yamlFor reference, you already have the contents of the health.lua script above, so you can copy it to the health.lua file in the $API_GROUP/$KIND folder. You also have the testdata/failed.yaml and testdata/healthy.yaml, copy them too from the YAMLs above.
The only file missing is the following:
health_test.yamltests:
- healthStatus:
status: Healthy
message: "The SQL instance is up-to-date."
inputPath: testdata/healthy.yaml
- healthStatus:
status: Degraded
message: >-
Update call failed: error applying desired state:
long explanation here of the error
inputPath: testdata/failed.yamlThis file basically contains the expected status and message as fetched from the Unit tests – that is, running the Lua script against the YAMLs above, and expecting the fields mentioned before to have the values defined here. You can also see each test includes an inputPath which points to the file you copied before.
The last step is running the tests. If you do not have Go installed, you need to resort to make test – it will run a fairly long process of bootstrapping an ArgoCD local build inside Docker, then run all the tests from ArgoCD.
A shorter version is, if you have Go installed, to cd into the folder where the Lua parsing resides, util/lua/, and run in here:
go test -v -run TestLuaHealthScript ./util/lua/This will output all the health checks, and among those tests there will be yours. They’re a bit hard to spot, but you can see that the tests are passing, and the health status is as expected if it reads:
=== RUN TestLuaHealthScript
=== RUN TestLuaHealthScript/testdata/progressing.yaml
=== RUN TestLuaHealthScript/testdata/degraded.yaml
=== RUN TestLuaHealthScript/testdata/healthy.yaml
--- PASS: TestLuaHealthScript (0.00s)
--- PASS: TestLuaHealthScript/testdata/progressing.yaml (0.00s)
--- PASS: TestLuaHealthScript/testdata/degraded.yaml (0.00s)
--- PASS: TestLuaHealthScript/testdata/healthy.yaml (0.00s)
PASS
ok github.com/argoproj/argo-cd/v2/util/lua 0.027sUsing these Health Checks in ArgoCD
For this, there’s also two options:
- You can rebuild your ArgoCD container image with the new health checks included; or
- you can put your health checks in the
argocd-cmConfigMap
The last option is the quickest and easiest, but keep in mind that ConfigMaps have a limit of ~1 MB, and quite often they grow due to the last-applied-configuration annotation field that clones all the previous data. If you run into the limit, rebuilding your container image with your custom health checks – and unit tests – would do just nicely.
For the time being, you can simply use the ConfigMap. Let’s update it with:
kubectl -n argocd edit configmap argocd-cmAnd add our own health check to the data field:
apiVersion: v1
kind: ConfigMap
metadata:
name: argocd-cm
namespace: argocd
labels:
app.kubernetes.io/name: argocd-cm
app.kubernetes.io/part-of: argocd
data:
url: "..."
resource.customizations: |
health.sql.cnrm.cloud.google.com/SQLInstance: |
health_status = {}

if obj.status == nil or obj.status.conditions == nil then
  return hs
end

for i, condition in ipairs(obj.status.conditions) do
  if condition.type == "Ready" then
    health_status.message = condition.message

    if condition.status == "True" then
      health_status.status = "Healthy"
      health_status.message = "The SQL instance is up-to-date."
      return health_status
    end

    if condition.reason == "UpdateFailed" then
      health_status.status = "Degraded"
      return health_status
    end
  end
end

health_status.status = "Progressing"
health_status.message = "Provisioning SQL instance..."
return health_status Where the way of defining them inside the argocd-cm is by using the template:
resource.customizations: |
  <group/kind>:
    health.lua: |
From the previous full argocd-cm code, the string content of the long key name must match the resource you’re validating. Save and close, and let Kubernetes do its thing. ArgoCD will automatically capture this and apply the new health check when a resource with that kind, SQLInstance and group, sql.cnrm.cloud.google.com is created or updated.
Looking at these health checks from the UI
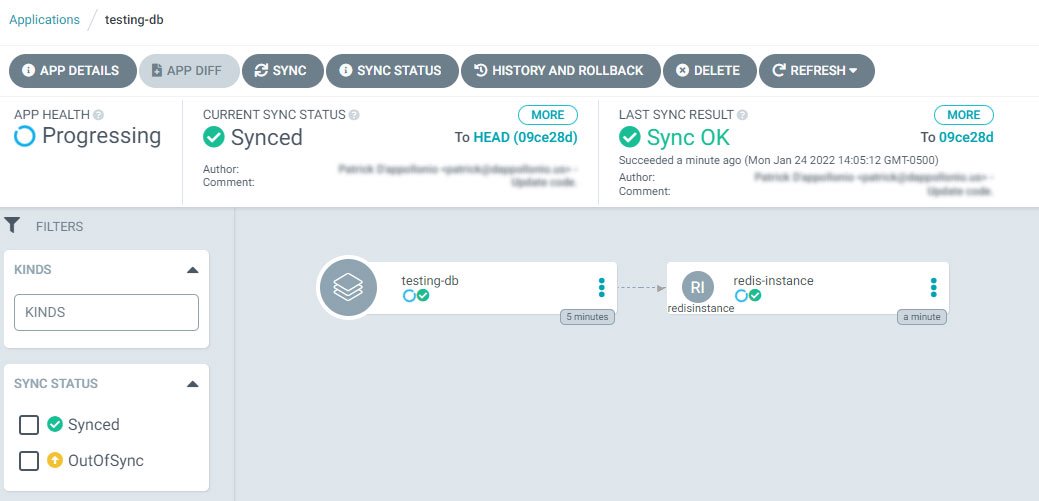
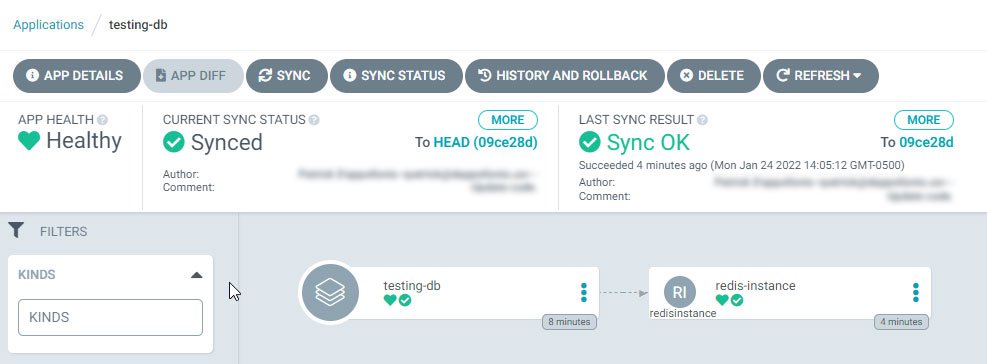
Here are a couple of examples on how this Health Check would look like in the ArgoCD UI – keep in mind these belong to another ACC resource, RedisInstance, but the process is pretty much the same if you’re doing SQLInstance, RedisInstance or any other ACC resource:

This is the “progressing” state. Keep in mind this is not the standard behaviour of ArgoCD for a controller-owned resource. Normally, ArgoCD would simply apply the manifest but not wait for the resource to be ready. The health check forces ArgoCD to wait for it.

The picture above shows how the resource looks like when it has finished the process of being created by the controller. In this case, this is shown after ACC creates the Google Cloud resource in a healthy way – that is, no errors.

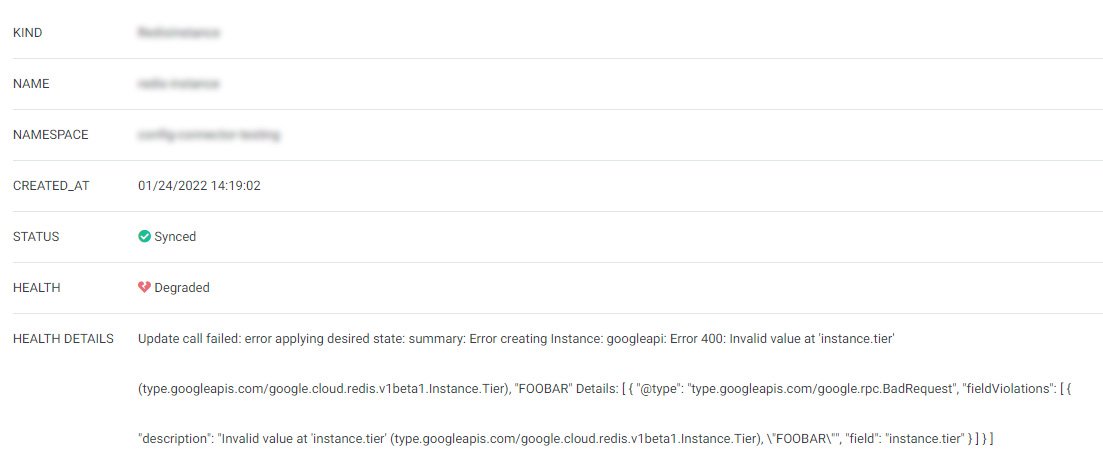
If something were to happen, since we propagated the original error message to the ArgoCD UI or CLI, we would be able to see it when clicking on the resource. Note, too, that the health state of the application is “Degraded”.
With all this in mind, considering sharing your ArgoCD Health Check upstream. It might benefit the next Patrick or the next ArgoCD operator and save them some time 🤣